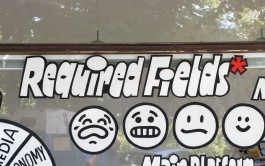
Required Fields*
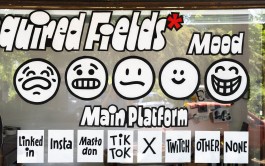
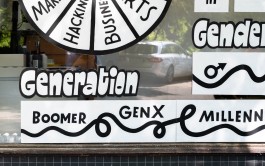
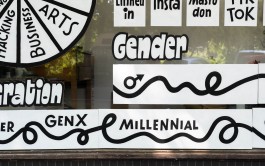
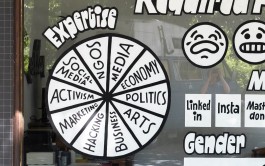
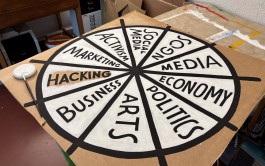
During re:publica 25, I stood next to a hand-painted infographic of my own design dressed up as a data scientist, inviting the confence participants to position themselves on the cardboard survey with sticky dots.
Format
acrylics on cardboard, sticky dots
Year
2025


An Analog Data Collection
Data, data, data! Data is being collected everywhere—and now I’m doing it too. But I went analog: visualizing it with colorful sticky dots on a 4 x 3 meter infographic made of cardboard.
During the conference, I stood by the installation dressed as data scientists in a lab coat, approaching participants, handing out sticky dots, and inviting them to visually position themselves on my cardboard survey.
This lead to complications: everyone was free to give false information, take part multiple times, and debate with me about the questions—is gender really is a spectrum? Shouldn’t a timeline be linear? And why is their favorite social platform missing?! As I hoped many people asked »What for?« and I happily answerd »For fun, of course!«
The project isn’t really about data or visualization—it’s about playful exchange and the conversations sparked by conducting analog survey at a conference dedicated to the digital society and collecting data in a way that makes them impossible to analyse or use beyond the visual impression gainen from the distribution of the dots.